Introduction
‘How does Unified Streaming perform’ is an important question, and a question that is raised now and then as Unified Streaming runs on many types of hardware and in many configurations.
However, it is not at all easy to answer: it depends on the hardware used but also on the setup at large of which Unified Streaming is a part, for instance, is the bandwidth upstream 100Mb/s, 1GB/s or 10 Gb/s? What kind of storage is used (SSD, slow NFS or some form of HTTP accessible storage). Is there a need for a large archive from a Live setup or not?
In the following chapters we will discuss various setups for common use cases to gain insight in how USP performs in ‘real’ situations.
Use cases
The use cases presented are the following:
- video on demand (VOD)
- Live streaming (events like the Olympics)
For VOD we will describe two different setups which are used by customers in production setups.
For Live we will describe three different setups which are used in production setups also.
By using and describing existing setups we hope to provide better insight to the possibilities and performance of Unified Streaming which are based on actual use case that are running 24/7.
About Unified Streaming
Unified Streaming is a leading provider of cross-platform video-streaming technologies.
We provide streaming from one source to any screen, any device. Combined with all popular DRM platforms, this significantly reduces operational cost and boosts time to market while addressing a broader audience.
USP fits into existing frameworks (Apache, IIS, Lighttpd, Nginx), allowing for quick ROI, high performance and great scalability.
Our products are in operation around the world, with customers ranging from broadcast networks, online content distributors and integrators to smaller companies.
website: www.unified-streaming.com
Catch Up TV (VOD)
Using three levels of caching
For it’s catch-up service, a broadcaster uses Unified Streaming. The catch up service typically is used by viewers after the show has been aired and there is a clear distinction between popular content and not-popular content, the longtail.
Caching levels and hardware
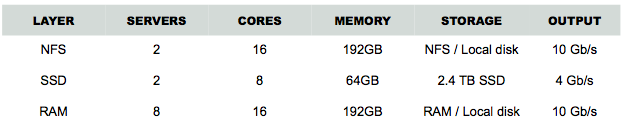
The three levels are the following:
- NFS
- SSD
- RAM disk
NFS
The NSF layer is used for the longtail: the viewers who request an item from the catalogue that is labeled as ‘not popular’ will receive a url from the loadbalancer which will direct straight to the nfs mounted origin.
The hardware used for the NFS layer is commodity x86 hardware in the form of blades placed in an enclosure.
For the NFS layer two blades are used.
Each blade has 16 cores, 92 GB RAM, 10 Gb/s network interface and a local disk (for booting the OS). So the max output of the NFS layer would be 20 Gb/s in total.
SSD
The SSD layer is used for content that is not longtail, but not yet very popular.
For the SSD layer the following hardware is used:
2U chenbro chassis with 24 2.5" slots
Intel S2600CP4 board with 4x Gbit NIC
2x Quad-core E5-2609 @ 2.4Ghz CPU
64Gb (8x8Gb) memory
3ware 9750-8i raid controller
2x Intel DC S3700 SSDSC2BA100G3 100Gb SSD's for OS
6x Intel DC S3700 400Gb SSDSC2BA400G3 SSD's
Intel I350 T4 quad Gbit NIC
For the NFS layer two of these servers are used, with a max output of 6 Gb/s and a total SSD volume of 2.4 TB
RAM
The RAM disk layer is used for the small percentage of content that is very popular. The hardware used for the RAM layer is the same as with the NFS layer (commodity hardware in the form of blades). The RAM disk size is 64 GB, 8 servers are use so in total there is 512 GB of RAM disk.
An overview:
Loadbalancer
If, for any reason, content becomes more popular the loadbalancer will notice this (by the raise in requests for the particular content).
A background process then uses this information to copy content from one layer to the other. The background process knows the sizes of the caches and so can copy the content to a cache that has sufficient storage. The loadbalancer then will direct to the the new location.
Content can be actively copied from NFS to SSD or RAM or from SSD to RAM.
Alternatively, a passive mode can be used where the loadbalancer redirects a viewer to a RAM disk cache node, where because the RAM disk layer is also connected to NFS the first request will pull the content in cache (the first viewer thus has to wait longer, but there is no active copying involved).
Software
As software is used Linux OS, Squid 2.0 (for cache locking) and Apache 2.4 with mod_lua (for scripting), mod_disk_cache, mod_proxy and Unified Streaming installed.
Python and Bash were used for some external scripting tasks.
Graphs
The following graphs show the performance of the three different levels, by day, week and month where ade99 is NFS, ade50 is SSD and ade10 is RAM.
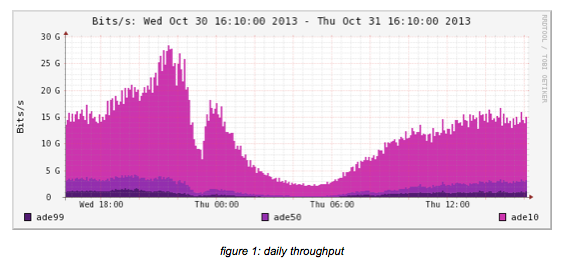
The above picture shows the daily throughput of the three levels:
- ade10 (light purple) is the RAM caching layer
- ade 50 (purple) is the SSD layer
- ade99 (dark purple) is the NFS layer
It is quite clear from this picture that the NFS layer is not used much, only for those few viewers who have specific interests.
The next two pictures show the behavior for the setup from a weekly and monthly viewpoint.
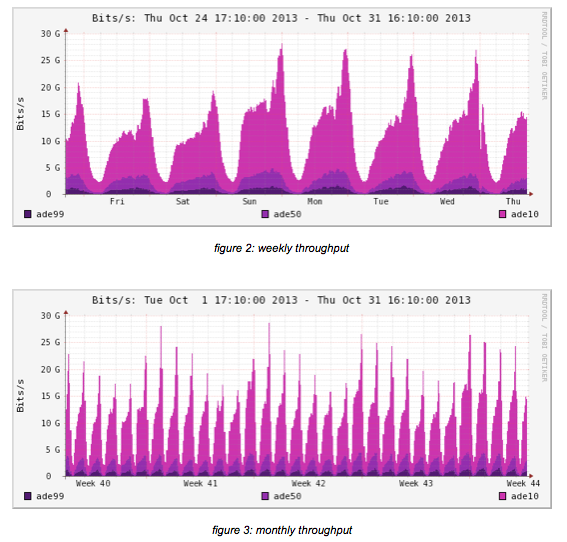
As can be seen from the graphs, the setup is stable and performs the same on average.
The graphs as shown are taken from the month of October 2012, however, it has been reported that the maximum load in November 2012 already was up to 65Gb/s at the peak moment.
NFS mounted origin with caching
In a different setup another broadcaster uses Unified Streaming for it’s catch-up service as well. This case is similar to the previous one in the sense that the service typically is used by viewers after the show has been aired, the setup, however, is different.
Caching levels and hardware
The levels use in this setup are the following:
- origin: NFS (Isilon)
- cache: SSD/Kernel
The origin has an NFS mount to the content and produces output on behalf of the caching layer. The OS used is Ubuntu 12.04 and Redhat Enterprise 6 with Apache 2.2 and Unified Streaming installed. Each origin has local storage and a 1Gb/s NIC.
The cache layer uses Windows as OS with IIS ARR (IIS Application Request Routing) as caching server. Two levels of caching are used: 128 GB of Kernel Mode Cache and an SSD layer on the same server. The NICs used are 10Gb/s Solarflare NICs.
The 25 caching nodes are grouped according their output: Smooth Streaming (2 cache nodes), progressive download (4 – 5 cache nodes) and the rest is caching HLS
Loadbalancer
The manifest requests are passed through the loadbalancer to a caching node which will request it from the origin (when not in cache). For for the actual content the loadbalancer redirects the viewer to a cache to serve the content directly, so it does not pass through the loadbalancer.
The loadbalancer is not ‘intelligent’ and thus not involved in copying content as with the previous case. Content is pulled from the origin into the SSD disk and when popular it is pulled into the Kernel Cache.
Hardware
The NICs used are from Solarflare and there are 2 in a trunked setup, so one caching node can output 20Gb/s.
The CPU’s used are dual 8 cores, so 16 in total per server.
Each caching node contains a 800GB PCI SSD disk, throughput is 5Gb/s
An overview:
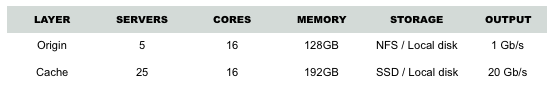
With the NIC’s trunked it is possible to achieve 20Gb/s output, with a 10 second chunk size (for HLS) — smaller chunks means less performance, so experience learned.
GRAPHS
There are two sets of graphs available for this setup:
• throughput of the ARR caching nodes • performance of the origin
The following two sections will outline these.
CACHING NODES
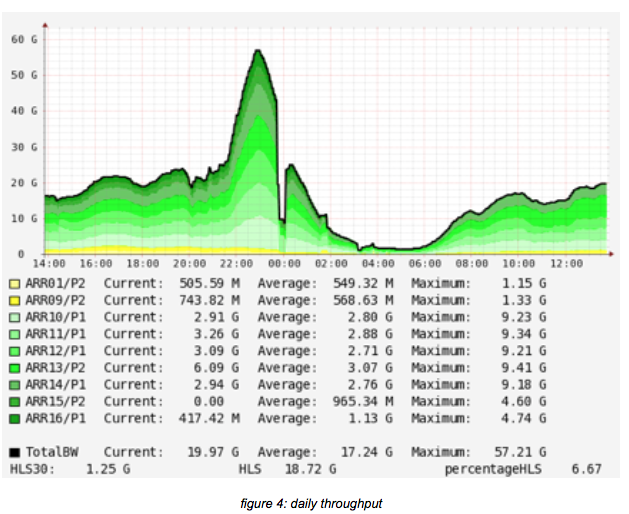
In the above picture the throughput of the ARR cluster is shown. The caching nodes are setup in ‘content clusters’. This means that the nodes are grouped according to what they cache: HLS, Smooth or progressive download.
From the group of 25 ARR nodes, 2 are used for caching Smooth, 4 – 6 are used for caching Pro- gressive (download, so mp4) and the rest is used for HLS.
As can be seen, there are 5 nodes with around 10Gb/s traffic, which are the HLS caches. There are 2 nodes with a load of around 4.75 Gb/s, which cache progressive and lastly there are two nodes for caching SmoothStreaming.
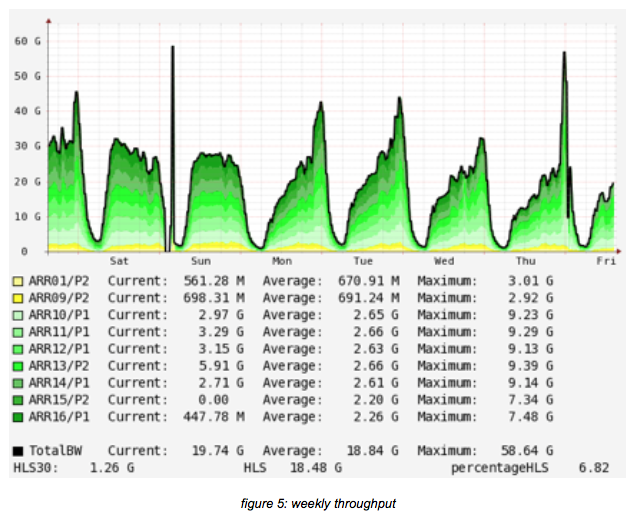
The above picture shows the weekly use the caching setup. Please note that the first spike is re- lated to maintenance (around switches and measurements).
ORIGIN
The following graphs will show various indicators at the Apache (2.2) origin running on Redhat 6.
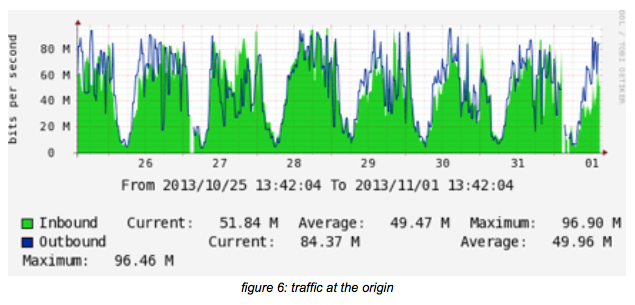
The traffic picture above shows how much traffic is pulled from the origin by the caching nodes.
The ratio between caching an origin can be learned from this as well: for an average output of 19Gb/s at the ARR level, around 50M/s is pulled from the origin.
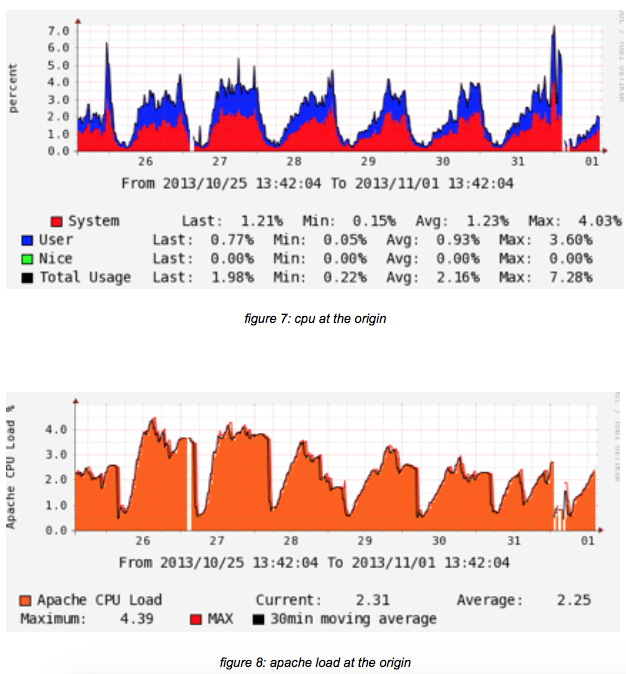
The next two figures show the CPU load and the Apache load involved. Both graphs are weekly.
STREAMING LIVE EVENTS
A lab test
A Content Owner wanted to benchmark it’s hardware for it’s specific use-case and see how many live streams it could ingest in a stable manner. The benchmarks tried were the following:
- SD stream in 3 qualities
- a HD stream in 5 qualities for an overall bitrate of 7600kbps
- add some HLS clients to simulate a Caching CDN.
Settings
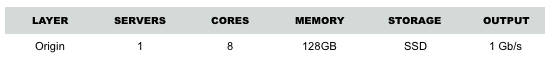
Server:
- 8 CPU E5-2670 0 @ 2.60GHz
- 128Go RAM
- 1 SSD
- 1Gbps
An overview:
The stream is pushed from another server using ffmpeg/copy
The server is running USP version 1.5.7 on Apache 2.2.22 (ubuntu 12.10) in prefork mode.
Streams are ingested on the SSD disk.
The isml file is created with default options “mp4split ‑o test.isml”
Nine Quicktime players reading the stream in HLS were used to check the visual quality during the test
SD Benchmark
Test stream:
- 3 video qualities: 800k, 450k and 200k
- 1 audio quality: 64k
- overall 1550k
With 200 streams ingested on the test server:
- network usage: 300 Mbps
- cpu usage is 45% of 1 Core (5% io wait), so it is 6% of all available CPU power of this server
- memory usage is 3GB
With 300 streams:
- network is 460Mbps
- cpu is 85% of 1 core (25% io wait)
- memory usage is 4.5GB
With 400 streams:
- network is 610Mbps
- cpu is 150% (50% io wait)
- memory usage is 6GB
During all the tests the 9 Quicktime HLS streams were working perfectly.
The disk bandwidth used is exactly the same as the network bandwidth (as expected). This means that the bandwidth of the network matches the disk bandwidth, the reason must be that USP writes everything that is ingested onto the disk in the .ISMV, so the disk must at least as fast as the network: ingest 100Mbps requires a disk that can do 12Mo/s or even more with the sqlite files which contain the metadata.
From these results it can be assumed that adding a second SSD will reduce the IO waits
No tests above 400 streams were made as the remaining network bandwidth would not be enough to feed the CDN in front of it. (It would require a 10Gb/s NIC to ingest more streams).
HD Benchmark
Test stream: 5 qualities with overall bitrate of 7600, the 2 additional qualities are 4Mbps and 2Mbps.
The results are:
* for 50 HD streams:
- network is 380Mbps
- cpu is > 40% of one core (no io wait)
- memory 3.2GB
* for 75 HD streams:
- network is 560Mbps
- cpu 65% (5% io wait)
- memory 4.5GB
* for 100 HD streams:
- network is 780Mbps
- cpu is 130% (30% io wait)
- memory is 6.5GB
So the interesting results are that a lot of the io waits comes from updating the sqlite files, this could be optimized by storing them in memory.
Conclusion
The hardware as described can safely ingest
- 75 HD streams
- 350 SD streams
HLS Output
For benchmarking the fragmentation process (the output side), a setup was used where each output was tested unitary (so main manifest, sub manifest, fragments), and each time it was found that the result is network bound.
The server can output around 20000 req/s on the main/sub manifest, and for the fragments it is network bound (1gbps), and the CPU usage is still really low.
75 live channels and NFS
For it’s live service of around 150 live channels a broadcaster is using Unified Streaming as origin.
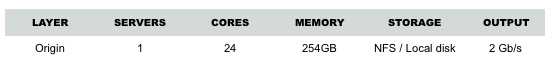
Hardware
The CPU of the ingest/origin server is Intel® Xeon® CPU E5-2640 0 @ 2.50GHz (24 cores), the server has 254GB of RAM and there are 2 NICs of 1 Gb/s bonded together.
For storage NFS is used. Ingest (and playout) comes from NFS as one of the requirements of this setup is to have per channel a large (7 days) archive which will take up quite a bit of storage.
The OS used is Red Hat Enterprise Linux Server release 6.4 (Santiago) / Oracle Linux Server release 6.4.
An overview:
Stream setup
The data shown is for 1 server that has approximately 75 channels.
Each channel only has 1 stream, which is either SD with a bitrate of 2.7 Mb/s or HD with a bitrate of 5 Mb/s
The origin is ingesting and playing out content at the same time
Caching
There’s 4 independent caches retrieving content from this server, thus the high output in bandwidth.
No further data is currently available on the caching setup and loadbalancer.
Graphs
The following section will show some performance aspects of the origin, namely traffic, cpu and memory used.
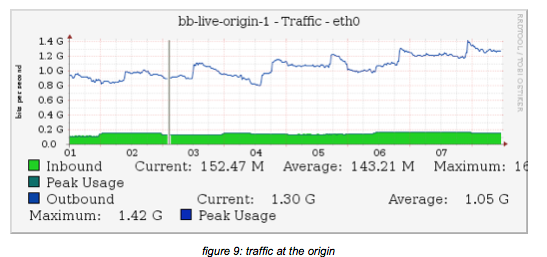
The outbound traffic is created by 4 independent caches all pulling from the origin
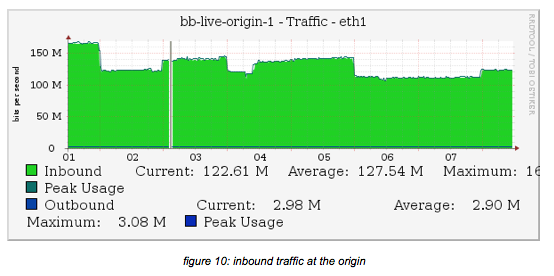
Please note that the data is for approximately 75 channels, from the above graphs it is clear that these are from a moment in time not all channels are ingested (as 75 * 2.7 would be 202 Mb/s if all channels would be SD).
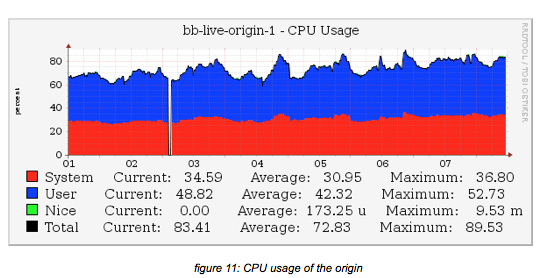
Above picture shows CPU usage on the origin over a period of 8 hours.
The percentage is higher than reported with the lab setup, but in our view, this is related to the storage used: all ingest and playout is to and from NFS — not local SSD as with the lab setup.
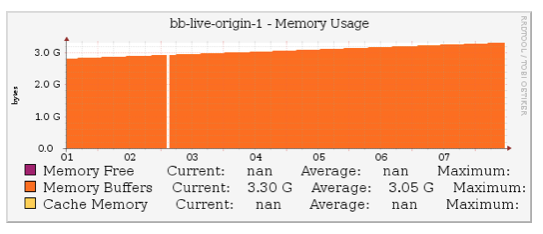
Above picture shows the memory usage over the same period. The numbers show a reasonable amount of memory used for the ingest/playout on the the origin.
Conclusion
In this setup it can be seen that the CPU use is higher than reported from the lab setup.
The sole cause seems to be that the use case requires a large archive for each ingested channel (up to 7 days — which for a 2.7Mb/s stream is about 204GB in total, per channel) which is stored on NFS and thus creating a lot more work for the CPU.
Streaming the 2012 Olympics
For the 2012 Olympics a broadcaster wanted to use Unified Streaming to stream the event and build a platform it could use further for VOD as well as other Live events.
Hardware
The hardware used for the newly built ‘HASP’ platform (HASP — HTTP Adaptive Streaming Platform) is commodity x86 hardware.
Two enclosures were used, each with 14 blades.
Each blade had:
- 16 cores
- 92 GB RAM
- 10 Gb/s network interface
Each enclosure had 100Gb/s out connected to the high bandwidth uplink at the NPO premise.
One of the blades from each enclosure was used as ingest/origin — this is shown in figure 13.

Software
As software was used:
- Linux OS
- Squid 2.0
- Apache 2.4
- mod_lua (for scripting)
- mod_disk_cache
- mod_proxy
- mod_smooth_streaming (USP 1.4.45)
Python and Bash were used for some external scripting tasks.
Bitrates
The bitrates used for the streaming platform were the following:

The live streams (14 max with the Olympics, 1 with the Tour the France and 2 simultaneous with the European Football Championships) were streamed from the encoders to both ingests and duplicated. This ensures robustness (the ingest will receive 2 inputs for each stream so when one stream should stop, ingest continues from the other).
The aggregate incoming data per stream on each ingest thus was 6050Kb/s (or about 6Mb/s, which is about 0.756 MB/s — under one MB per multibitrate stream).
In total each ingest had about 169.4 Mb/s incoming for the maximum case of 14 live Olympic streams (14 * 6.05 = 84.7 Mb/s but duplicated so times two, which is 169.4 Mb/s)
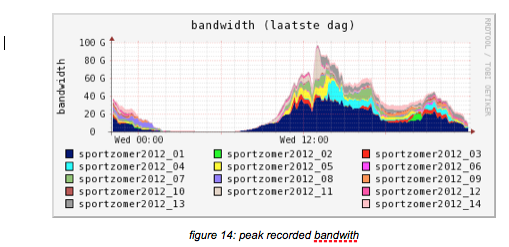
Peak
The peak moment recorded was slightly over 100 Gb/s as aggregated output of all edges to 70.000 simultaneous viewers:
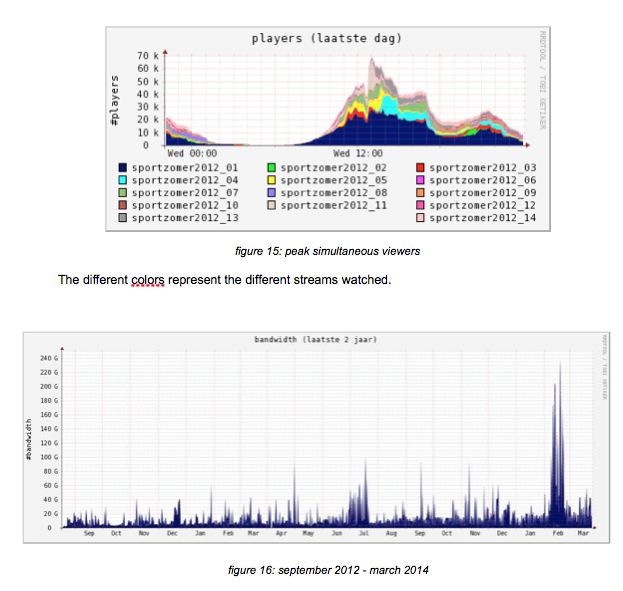
Above picture was taken from ‘EBU Broadthinking 2014, 15_Verharen_NPO_HTTP-streaming’ and it show the use of the platform over a longer period of time, September 2012 — March 2014. The peak in February 2012 is the Sochi Winter Olympics. Traffic shown over 200G is handled by the overflow, the KPN CDN — but still coming from the same origins.
Caching
As can be seen from figure 1, caching was used heavily. In effect, only one blade in each enclosure was used as ingest/origin. The thirteen other blades were used as caching edges. Caching was setup using Apache 2.4 and mod_disk_cache as well as mod_proxy for the reverse proxy (so when fragments were not in the cache they could be fetched at the appropriate origin).
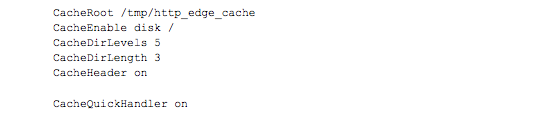
Relevant proxy part of the configuration file (the vhost config):

And for the caching part:
Locking
Unfortunately, cache locking in Apache is not working very well with either the process or thread worker model. The event worker was deemed to too immature to rely on it, even though its locking implementation seems to be better.
To address this issue Squid 2 was used. Initially only on the origin, but it was found out that this was not sufficient: Squid 2 is single threaded and the Squid process was maxing out the one CPU it could use on the origin.
Therefore, Squid was also put in place on each edge, effectively employing a ‘double locking strategy’. For each cache miss (not finding a HLS, HDS or SS fragment) the edge would do only one fetch at the origin and as the origin also used Squid only one edge effectively fetched from the origin. Other edges requesting the same fragment would be served from Squid on the origin.
This double locking lead to a very stable situation where the origin served each fragment only once. Load on origin was very low: each fragment ingested was originated only once.
Cache hit/miss ratios
No statistics were kept of hit/miss ratios on the edges with the actual events — during the testphase were edge performance was deemed to be sufficient for the expected load.
However, given de double locking strategy as mentioned above combined with the data from figure 5 it can be understood that the average load per viewer at that moment was 1.625 Mb/s
served so on a total load of 1.13 Gb/s per edge a minimum of 1.625 Mb/s would be fetched from the origin per stream type (HDS, HLS of SS) to a combined load on the origin of 4.875 Mb/s.
The calculated hit ratio therefore is 0.9956% and the miss ratio is 0.0044%.
Conclusion
USP performed very well and proved to be a stable and scalable streaming platform.
During the 2 Olympic weeks over 5 million online viewers visited the NOS Olympic site and at peak moments, as for intance the Gold medal of Dutchman Epke Sonderland, the combined traffic was over 100 Gb/s on the HASP platform.
An addional overload was created for subscribers of KPN (a Dutch telco) pushing the total amount of data streamed during the Olympics to over 130 Gb/s
This has made the NOS/NPO conclude to add more (edge) servers for the next big event.
Thus asked, dr. ir. Egon Verharen, manager NPO R&D and responsible for the setup of the new streaming platform, said the following “USP has proven to be the best choice for flexible and scalable streaming platform able to deliver quality streams to all relevant client apps and devices that our audience use at the moment.”
